
I love the Chicago Cubs, and given the team’s history, it’s probably not much of a surprise that the Cubs’ 2016 World Series Championship felt surreal. The Cubbies won the World Series in 1907 and 1908, and then not again until 2016. It was more than a drought.
But, let’s look at the past 50 years of Cubs’ performance, from 1972 to 2021. This is as good of a time as any to give a shout out to Sean Lahman and the crew working on the Baseball Archive. It’s incredible stuff. The data behind these graphs comes from the dataset, End of the Season, 2021, 1996 to 2022 by Sean Lahman.
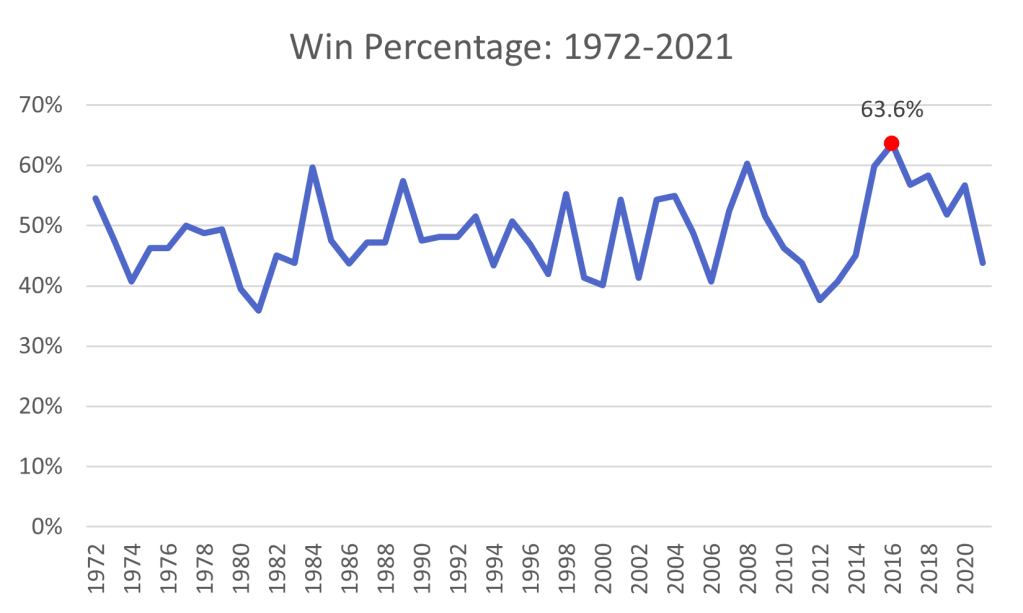
As shown in the graph above, the Cubs hit a high in 2016, with a season win percentage of 63.6%. Certainly not too shabby, especially compared to the previous stretch from the early 1970’s on. From 2012, to 2016, the team was building. You could say the team was building from 1908, but let’s stay focused on the modern era. We’d seen this before. The 1981 season ended with a win percentage of 35.8%. By season end in 1984, the team had climbed out of the deep valley of sorrow, to a season win percentage of 59.6%. It would be the strongest season until 2008.
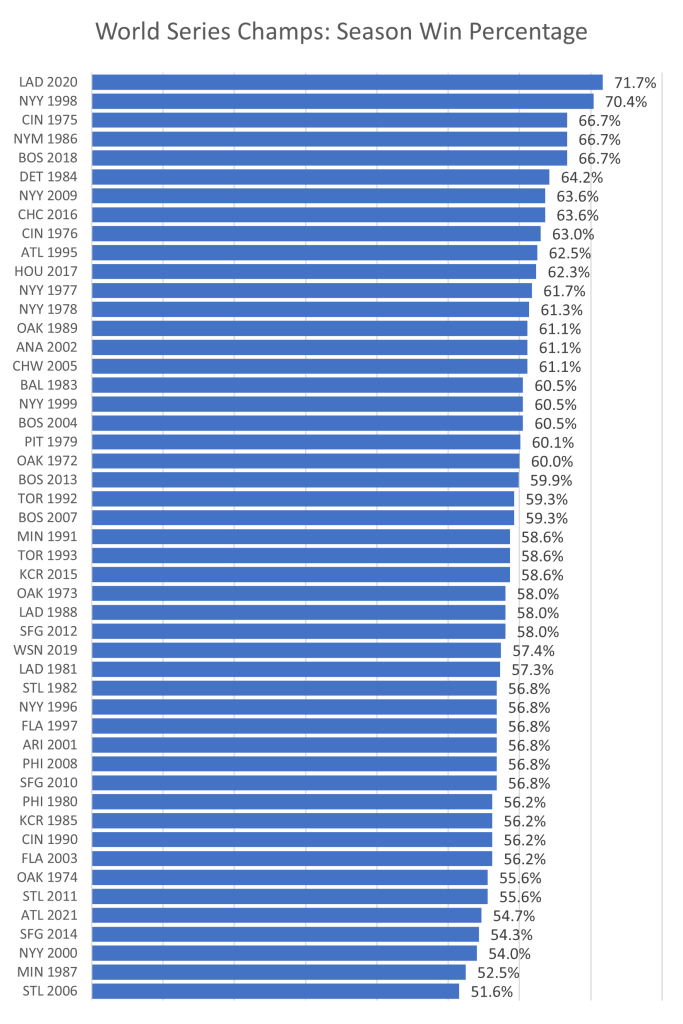
You might be thinking, what is the share of wins a team needs to be crowned the World Series Champs? The Chicago Cubs had the 8th highest win percentage of any World Series Champion team since 1972. Interestingly, the Cardinals and Twins won their World Series with shy of 53% wins during the regular season in 2006 and 1987, respectively. I think I may have been at one of those regular season Twins games. I remember being in the stadium and waving a Homer Hankie. I suspect Kirby was knocking them out of the park. But, I was also probably more focused on frozen ropes than the at bat ratio.
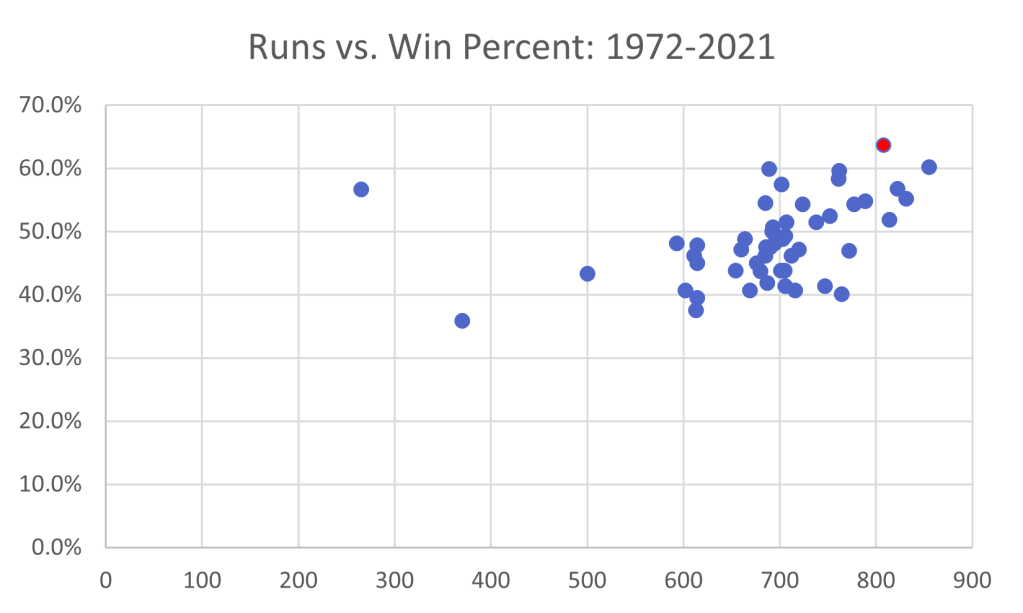
We know that the Cubbies need a lot of runs to win games. Although offense isn’t the only aspect of winning, it sure is a lot of what makes a win. 2016 wasn’t the 50-year high for runs, but it was certainly in the top tier. You’re probably staring at that weird left-most outlier. That’s 2020 data. The pandemic was not kind to getting many games in, but we did get some baseball and that’s all I could have asked for.
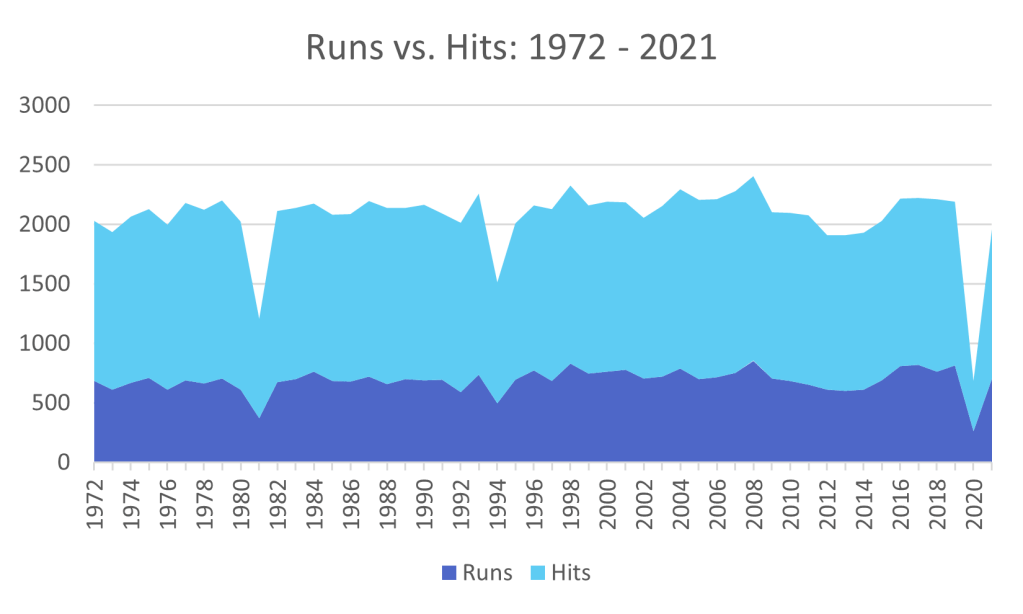
2008 was another good year for runs, as was 2017 and 2019. Neither of those years translated to WSC, but it had us dreaming. Even with all those runs, the competition was strong and there were holes in the defense. Regardless, it’s interesting to look at run and hit comparisons.
Before the 2022 season began, I was talking with a friend who asked where I saw the Cubs’ season win percentage landing. As of today, we’re at .406 and are sitting in third place in the NL Central. We’re in the back half of the season. The trade deadline is two days away. I’m hoping we can hit .430 for the season and keep the rebuilding happen. Besides, there have only been 18 seasons over .500 in the last 50 years.
